Mean, Median and Range: Choosing the Right Summary
Understand three useful ways to describe a small set of numbers, with an outlier example.
Start with the complete data
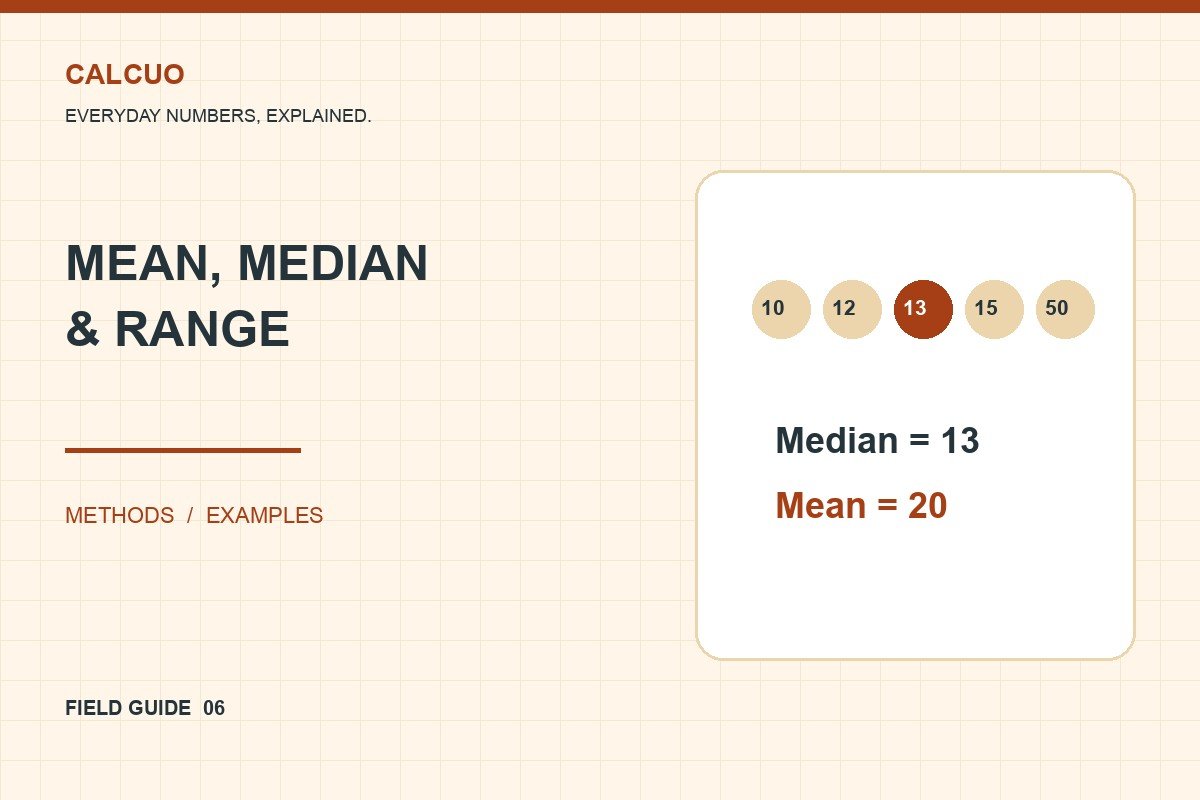
A summary is useful only when you know what the numbers represent. Are they measurements, durations or counts, and do they use the same units? For a simple example, consider five task durations in minutes: 10, 12, 13, 15 and 50. The much larger final value will affect some summaries more than others.
Calculate the mean
Add all the values and divide by how many there are. The total is 100 minutes and there are five tasks, so the mean is 20 minutes. Every value contributes to this calculation. A particularly large or small value can pull the mean away from the centre of the other observations.
Find the median
Arrange the values in order and identify the middle one. In this five-value example, the median is 13 minutes. If there is an even number of values, take the mean of the two middle values. For 10, 12, 14 and 20, the median is (12 + 14) ÷ 2 = 13.
Describe the range
Subtract the smallest value from the largest. For the original example, the range is 50 − 10 = 40 minutes. This describes the spread between the extremes, not the typical duration. It uses only the two endpoints, so datasets with very different internal patterns can still have the same range.
Choose a summary for the question
If you need the arithmetic average across all tasks, report the mean. If you want the middle observation and are concerned about an unusually large value, the median may be informative. Neither is universally better. Reporting both, alongside the number of observations, can show a reader that the data are not evenly clustered around one value.
Avoid common traps
Do not assume that missing values are zero. Check whether a zero is a genuine observation before including it. Be careful when combining group averages: groups of different sizes need appropriate weighting. For example, the average of two class averages is not necessarily the average across all students. Keep the units, sample size and any exclusions visible so that the summary can be interpreted fairly.